“Slope Graphs” are gaining some popularity thanks to Edward Tufte: http://www.edwardtufte.com/bboard/q-and-a-fetch-msg?msg_id=0003nk
ggplot2 makes Slope Graphs easy to plot via the geom_path() function.
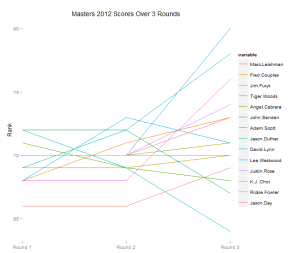
The below code plots rounds 1, 2 and 3 of the 2012 Masters tournament, scraped from ESPN.com at the time of the competition on a Slope graph. Note that I’ve displayed the information quantitatively, i.e., the golfer’s actual scores over the 3 Rounds. This doesn’t align with the spirit of the Slope graph, which is better for qualitative views of data. In a future version it would be better to calculate relative rank on each day, then display the change. It works out OK here because golf scores seem to remain within a relatively stable range.
library(reshape)
library(ggplot2)

Data.masters=structure(list(PLAYER = structure(1:3, .Label = c("Round 1",
"Round 2", "Round 3"), class = "factor"), Marc.Leishman = c(66L,
66L, 69L), Fred.Couples = c(68L, 71L, 73L), Jim.Furyk = c(69L,
69L, 70L), Tiger.Woods = c(70L, 70L, 71L), Angel.Cabrera = c(71L,
69L, 68L), John.Senden = c(72L, 72L, 67L), Adam.Scott = c(69L,
72L, 78L), Jason.Dufner = c(72L, 69L, 64L), David.Lynn = c(68L,
73L, 71L), Lee.Westwood = c(70L, 70L, 80L), Justin.Rose = c(70L,
70L, 70L), K.J..Choi = c(70L, 70L, 74L), Rickie.Fowler = c(68L,
68L, 76L), Jason.Day = c(70L, 70L, 73L)), .Names = c("PLAYER",
"Marc.Leishman", "Fred.Couples", "Jim.Furyk", "Tiger.Woods",
"Angel.Cabrera", "John.Senden", "Adam.Scott", "Jason.Dufner",
"David.Lynn", "Lee.Westwood", "Justin.Rose", "K.J..Choi", "Rickie.Fowler",
"Jason.Day"), row.names = c(NA, 3L), class = "data.frame")

df.set.m <- melt(Data.masters, id.var = c("PLAYER"))

ggplot(df.set.m, aes(PLAYER, value, group = variable)) +
theme(panel.background = element_rect(fill = 'white', colour = NULL)
,panel.grid.major = element_line(color="white")
,panel.grid.minor = element_line(color="white")) +
scale_x_discrete(expand = c(0, 0))+
geom_path(lineend="round",aes(color=variable
#,size=.5
#,alpha=Change
)
)+
xlab(NULL) +
ylab("Rank") +
ggtitle("Predicted Rank vs. Actual Rank")
An interesting annotation: it seems that the first day of golf has relatively less variance in scores than the last day. Notice how in Round 3, the scores really start to separate. This could also be due to some occurrence that day (i.e., weather), but the graph at least suggests that in order to do well in the masters, consistency and momentum play a role.
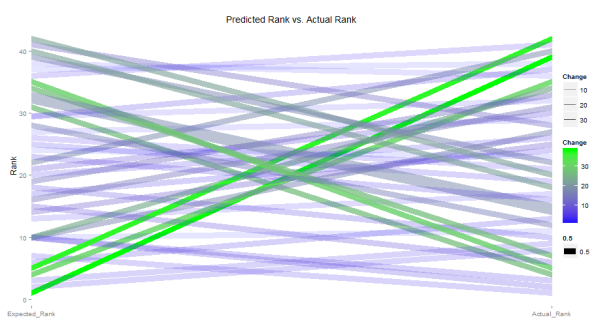
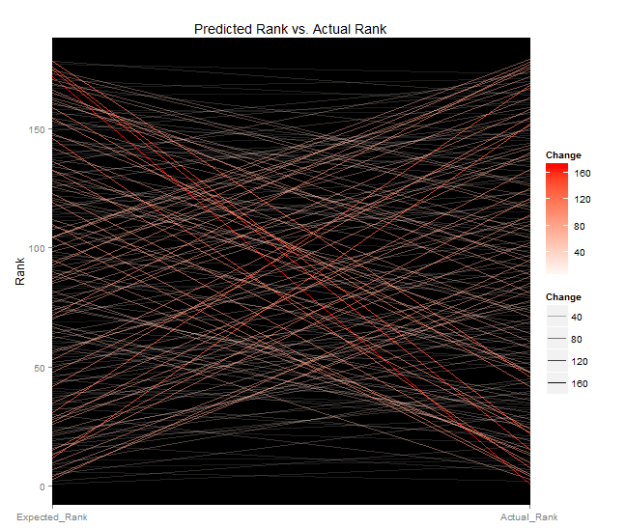
A few more examples, here plotting Predicted Rank of a GBM model vs. Actual Rank:


